
Metacity / Datatown
Datatown is based only upon data. It is a city that wants to be described by information; a city that knows no given topography, no prescribed ideology, no representation, no context. Only huge, pure data. What are the implications of this city? What assumptions can be identified? What agenda would result from this numerical approach?
- Location
- Netherlands
- Status
- Design
- Year
- 1999–1999
- Client
- Stroom Centre for the Visual Arts, The Hague
- Programmes
- Research
Awards
.png?width=360&height=360&mode=pad&quality=75)
2000International Media Art Prize
Honourable mention
.png?width=360&height=360&mode=pad&quality=75)
Due to ever-expanding communications networks and the immeasurable web of interrelationships they generate, the world has shed the anachronism 'global village' and is transforming into the more advanced state of the 'Metacity'. More and more regions have become more or less continuous urban fields: Europe, the fringes of North America, Southeast Asia, India, Indonesia.
And as the population and its communications options continue to multiply, this metamorphosis seems far from finished. Not only has this process increased the number of these urban zones; it has also intensified the 'in-betweens'. Even the former anti-urban elements are colonized; they are now concentrated parts of the urban condition: nature has become crowded; agriculture needs to intensify due to an increased demand and a reduced amount of available space.
Even though this global transformation seems to be weakened by competitive nationalism that makes a worldwide Balkan composition imaginable, such regionalism might also be a way to escape from this very protectionism: through specialization, each region enhances its global position. This difference, and the continued demand for the specialties of 'elsewhere', make every region dependent on a series of others, thus enforcing a symbiotic balance among them.
Though other fields stress the importance of this matter, it rarely enters the realms of architecture and urbanism. These professions, in their obsession with the unique, exaggerate the individualistic. In their concentration on and embrace of the singular object, they enclose themselves within their given boundaries.
Dirty realism as style-figure. Although they advocate 'discourse' with other professions and they suggest this advocacy with 'open forms', they hardly escape the formalistic. But addressing the spatial implications of this global act could actually help to define an emerging agenda for urbanism and architecture.
How to study this Metacity? Initially, one can describe its vastness and explore its contents perhaps only by numbers or data. Its web of possibilities - both economical and spatial - seems so complex that statistical techniques seem the only way to grasp its processes.
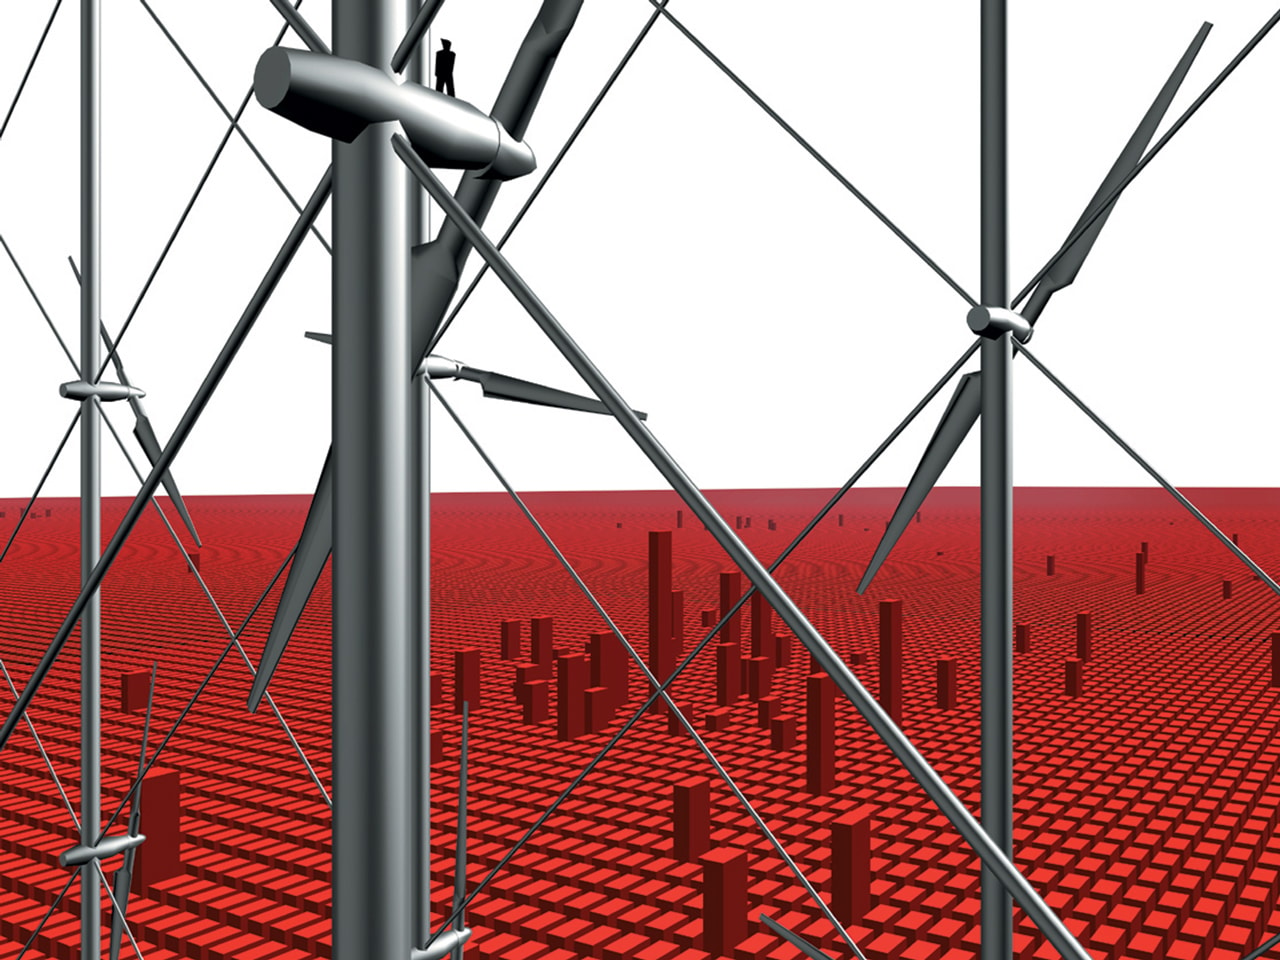
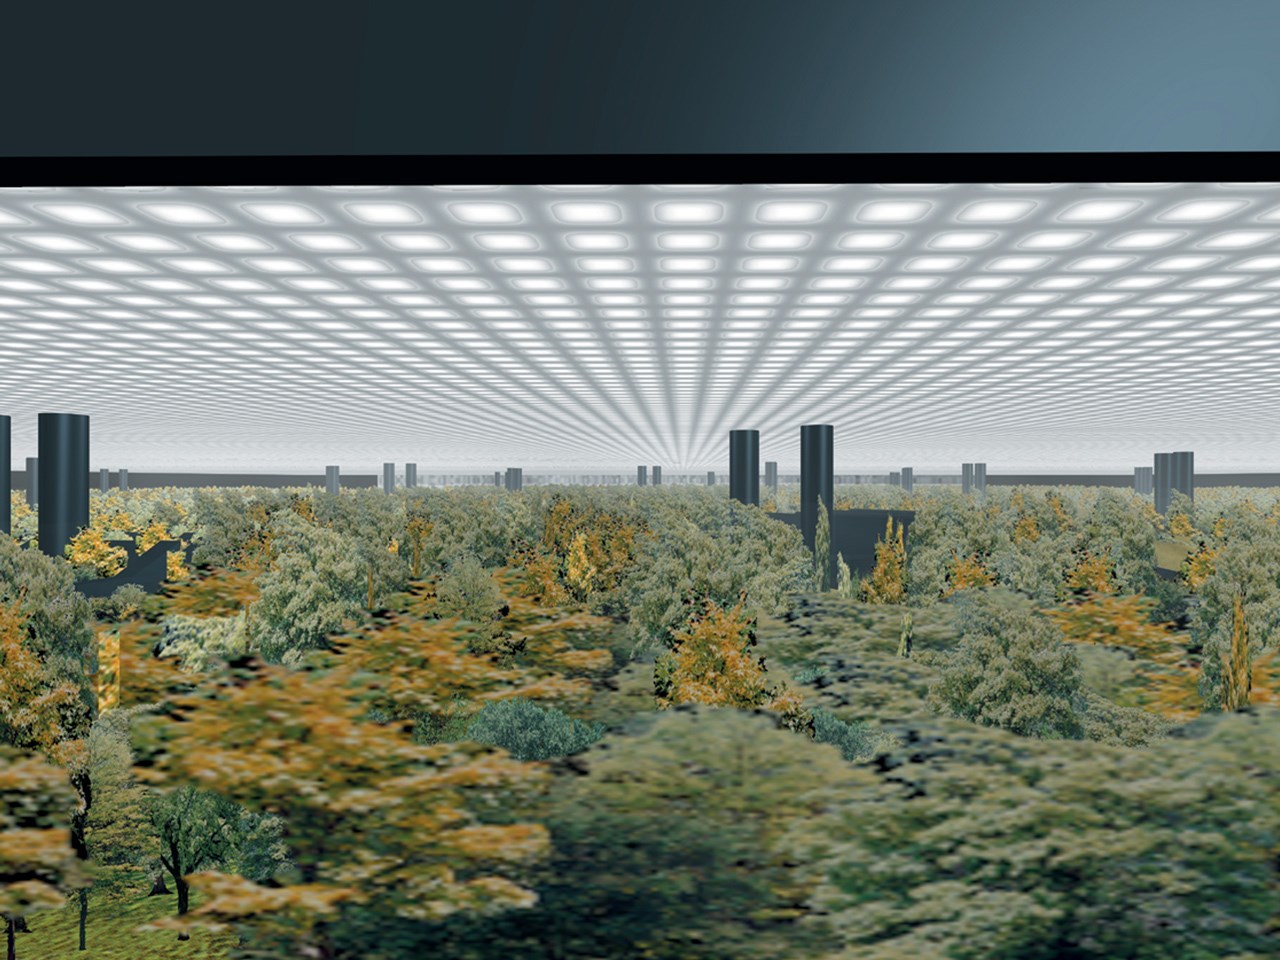
By selecting or connecting data according to hypothetical prescriptions, a world of numbers turns into diagrams. These diagrams work as emblems for operations, agendas, tasks. A 'datatown' appears that resists the objective of style. One way to study the world of numbers is through the use of 'extremizing scenarios'. They lead to frontiers, edges, and therefore to inventions. If we imagine the most extreme state of the Metacity's enlargement of urban conditions - and thus the reduction of available space - new urban inventions might start to emerge. Looking at the world's available territories, only a scant percent of the earth's total surface currently can be imagined as usable urban space - for living, for industry, for agriculture, for water-cleaning, and so on. Seas, oceans (which increase due to global warming), mountains, jungles, deserts, polar zones all represent reductions of the 'usable' territory for the Metacity. Does this mean that we need to colonize the Sahel, the oceans, or even the Moon to fulfill the need for air and space - to survive? Or can we intelligently enlarge the capacity of our existing domain? This observation of considerable lack of space could trigger a series of extrapolations, scenarios, 'what-ifs'... Pursuing this sequence of hypotheses leads to a town of data.
Datatown, therefore, is not a design; it is not about mix or not-mix, about compositions or relations. It can be seen as a prelude to further explorations into the future of the Metacity, explorations that could induce a necessary round of self-criticism in architecture and urbanism, and even a redefinition of practice.
Datatown is based only upon data. It is a city that wants to be described by information; a city that knows no given topography, no prescribed ideology, no representation, no context. Only huge, pure data. What are the implications of this city? What assumptions can be identified? What agenda would result from this numerical approach? Datatown is based on an extrapolation of Dutch statistics. Though the Netherlands today seems a dreamland for econmics, culture, and production, it remains suspicious to follow its doctrine. But the accessibility of statistical information makes it a useful instrument for extrapolation. Datatown follows a classical (didn't the Dutch architect Carel Weeber repeat that recently?) approach of defining the boundaries of a city, namely that the urban size is equivalent to one hour of traveling. In the Middle Ages it was 4 km of walking.
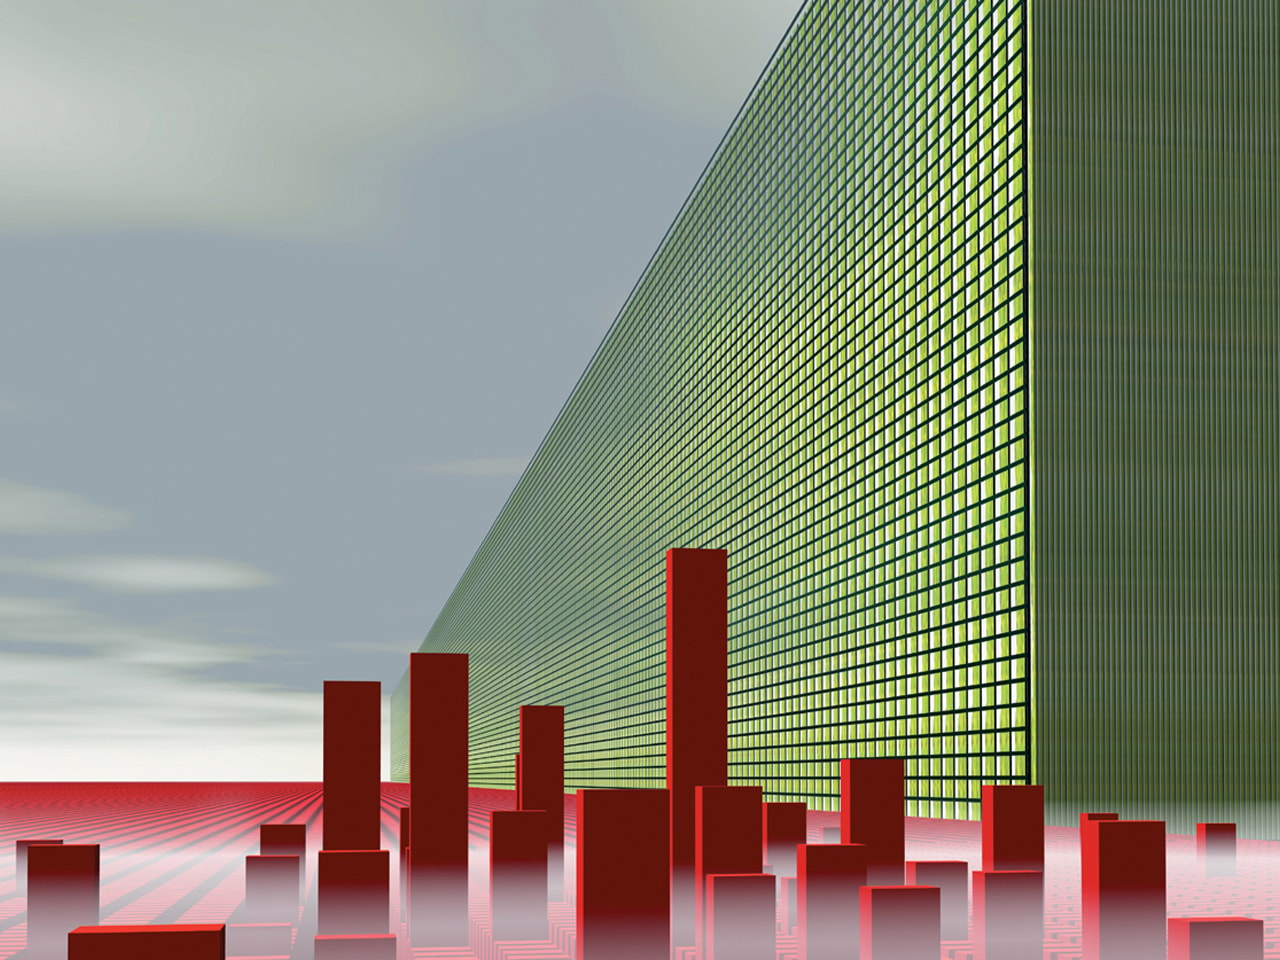
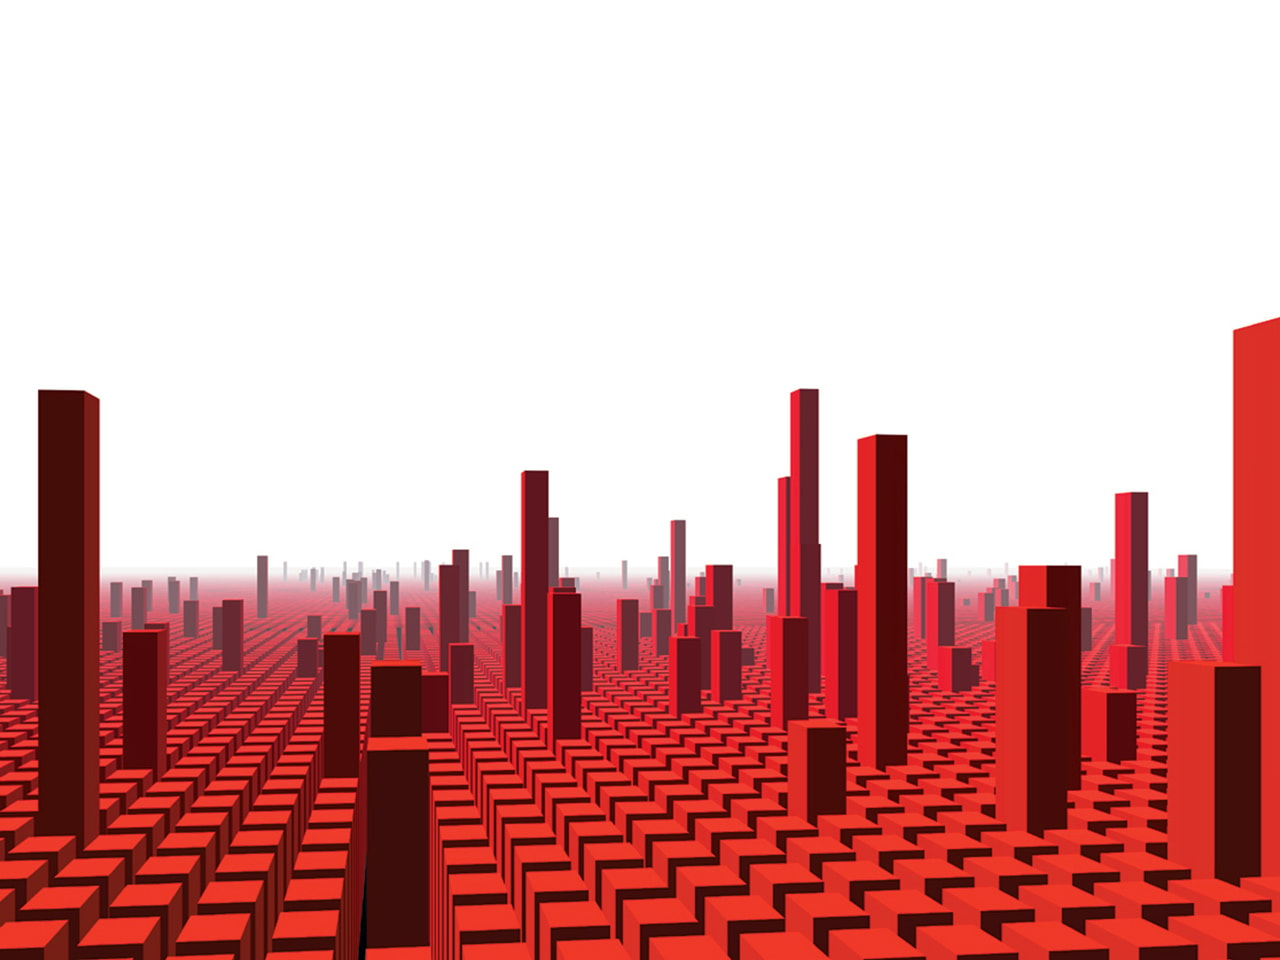
In the 1920s the development of garden-city extensions was based on a bicycle-distance of 20 km. The mass use of the car lead in the 1980s to cities of about 80 km like the Randstad or Los Angeles. And now, with the bullet-train, the city can equal 400 km. Datatown can therefore be defined as a city of 400 by 400 km: 160,000,000,000 m2. Datatown is dense - let us say 4 times as dense as the Netherlands, one of the densest populations in the world.
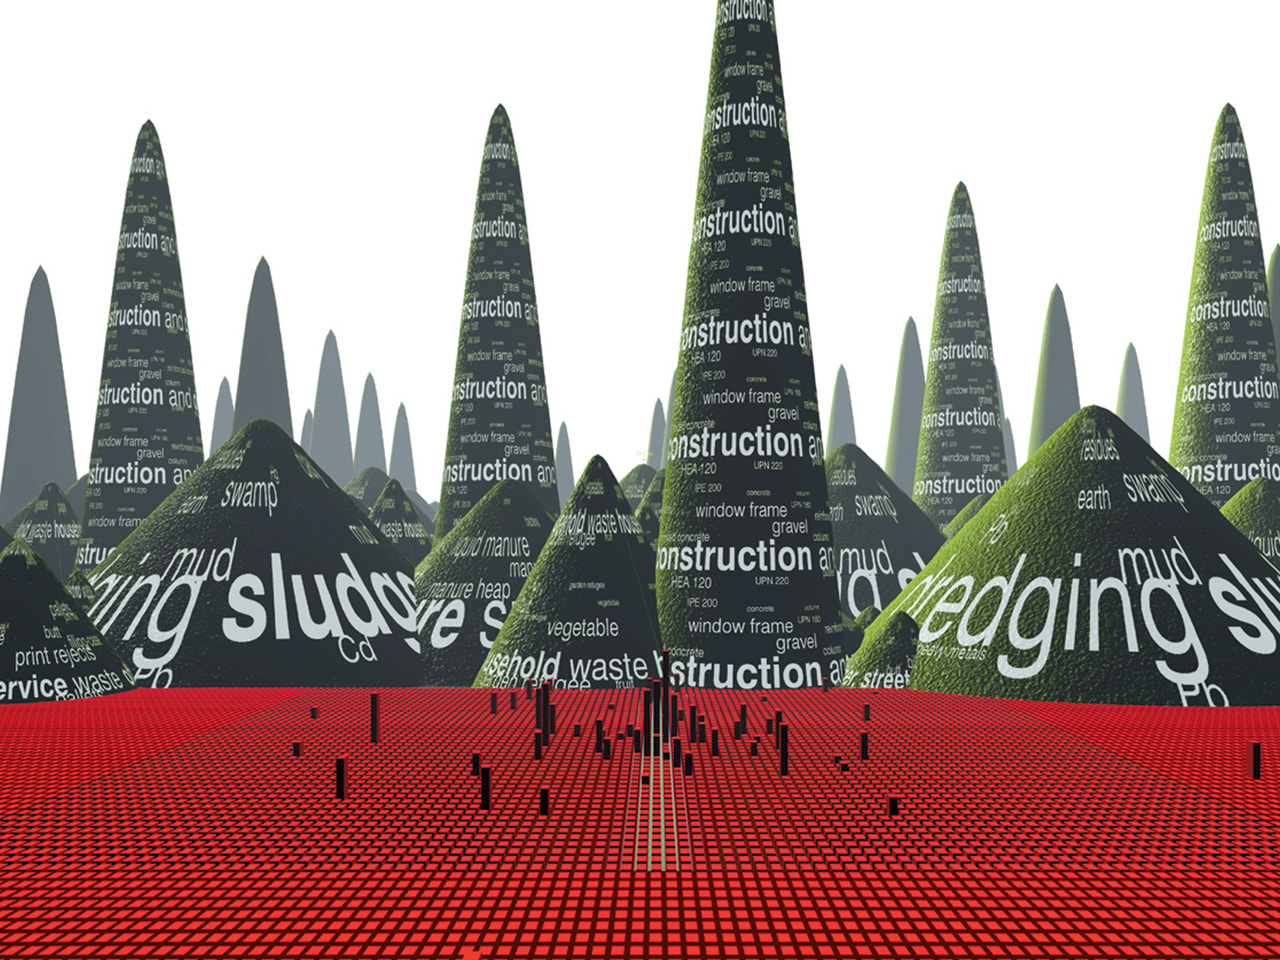
In fact, with 1,477 inhabitants per square kilometer, Datatown is the densest place on earth. It is a city for 241 million inhabitants. It is the USA in one city. Datatown is autarkic. It does not know any foreign countries. It therefore has to be self-supporting. Its problems must be solved within its boundaries. Datatown is constructed as a collection of data. This information has been sorted and gathered in sectors, relative to the percentages of existing use in the Netherlands. Initially ordered alphabetically within a barcode field, the information was transformed for practical reasons: some zones need wider measurements in order to function properly.
METACITY/DATATOWN is based on the video installation of the same title produced by MVRDV for the Stroom, Centre for the Visual Arts, The Hague, and exhibited from 12 December 1998 through 13 February 1999.
The video installation was the second part of the project 'Metacity' that was conceived by Jan van Grunsven, Winy Maas and Arno van der Mark in collaboration with Stroom.
Metacity Datatown book.
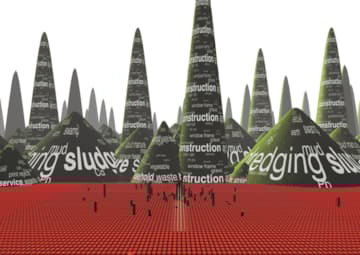
The barcode thus became a Mondrian-like field, compressed by its square outline into the most compact city thinkable. Datatown is based upon a series of assumptions. Each sector exists in several variations. They are constructed on a series of 'what-ifs' that embody different assumptions. Datatown is always in progress. Its evolution is literally endless; it is permanently under construction. At this moment, 6 sectors may be entered.
If the world settlement envelope has been filled up with 376 Datatowns, the world capacity will be 88,687 million inhabitants, 18 times the current population.
Gallery

Past events
The Why Factory.jpg?width=300&height=300&quality=75)
Discover more Metacity / Datatown

.jpg)
Credits
- Architect
- Design team